
A key aspect of conducting a systematic review and meta-analysis is understanding how big or small the treatment effect is for each study. Meta-analysts use formulas that allow us to compare and ultimately combine effect sizes, the general term for representing the relationships of interest across different studies. Effect sizes are typically computed from basic descriptive information reported in the primary study, such as the means and standard deviations from each condition. Although the concept of effect sizes is relatively simple, identifying the correct information and implementing the appropriate formula to compute them can be challenging in practice. This process is especially difficult when immediate feedback, like seeing the effect size once it's calculated, is not available.
For these reasons, we are proud to introduce the calculation of effect sizes in real-time as one of MetaReviewer's core features.
Why was it important to include effect size calculations in MetaReviewer?
We know the pain of identifying and calculating effect sizes because we routinely struggle to calculate them ourselves. Scientific literature has yet to adopt a standardized approach to reporting the information required to calculate an effect size, which means each time we code a study, we are presented with a new challenge. We must decipher what information is available throughout a research report, determine which formula can accept and convert the available information, and translate it into a standardized numeric representation of the magnitude of the effect.
New features for smoother workflows
The first feature is to show users which data are required for a particular effect size type. Calculating a standardized mean difference from a T statistic, F statistic, or linear regression model? MetaReviewer shows you the information you’ll need to use to estimate that effect. We launched this feature during our Beta testing period in fall of 2022; the feedback from users indicated that it worked well.
The second feature is to actually calculate the effect size in real time. We’ve taken the guesswork out of the process by providing users with immediate feedback: the effect size appears as soon as the pertinent information is entered. Simply seeing the effect size right away on the screen (and the effect size’s variance, by the way) provides important information that you can use to verify the information you collected and entered. What do we mean? Most effects fall between negative 1.0 and positive 1.0. Seeing how large the effect size is gives users a quick way of judging if the information collected is reasonable. Seeing an effect size of, say, 4.6578, would likely mean some piece of information was collected or input incorrectly. We feel it is crucial to catch such mistakes in the moment, as each study’s information is being entered, rather than computing the effect sizes all at once at the very end of the data extraction process.
The combination of knowing which information is required and the ability to visualize the effect itself is powerful, and we expect this tool will keep the burden of this process low for review team members.
How should users approach the effect size calculation functionality?
We think users will get the most out of the functionality by using it in one of two ways.
The first way is particularly useful for folks who have little experience finding the information necessary to calculate an effect size. For these researchers, we suggest selecting various options within the “ES Type” dropdown so that the fields “appear” within the row. We illustrate this with two different examples below. In the first screenshot, a user selected “SMD: Posttest only, Unadjusted Means.” As a result, six fields appear reflecting the required information. The first three are shown in the screenshot: the posttest mean of the intervention group, the posttest SD of the intervention group, and the posttest mean of the comparison group.


In the second example, a user selected “SMD: Posttest only, T Statistic”. This opens up three different fields for the user to enter information into: posttest sample sizes of the intervention group and the comparison group, and the overall posttest T statistic.

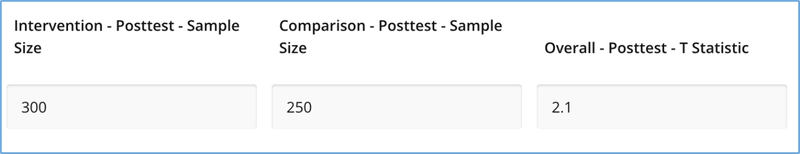
Being able to see what information is required to estimate a particular effect size allows users to go back to the study and work with what information is available. Perhaps the study reported the means and T statistic but not the standard deviations. Users would then select the “SMD: Posttest only, T Statistic” option and enter the appropriate data.
The second way to navigate the interface is best suited for users who already know the information they have and can select the option that’s most appropriate. In our experience conducting meta-analyses, we try to calculate effect sizes in the same way across as many studies as possible. Experienced users will find the functionality straightforward and helpful for this purpose.
In both ways, entering information into the fields will produce an automatically calculated effect size and the effect size’s variance. The screenshot below contains effect size estimates and variances for a “SMD: Posttest Only, Unadjusted Means” and a “SMD: Posttest only, T Statistic.” Because these are two different effect size types, we see that two different rows represents “Unadjusted Means” and the “T Statistic” effect size and its variance.


What is available as of this posting?
Many effect size types, variations, transformations, and approximations exist. So many, in fact, that even the most complicated R packages designed specifically for effect size calculations lack some of the existing options. We are therefore forced to make choices about what effect sizes to include in this version and what must wait for later MetaReviewer versions.
As of December 2023, MetaReviewer includes the calculation of 13 different effect size types. We started with the calculation of standardized mean-difference, adjusted for small-sample bias (aka Hedges’ g). We chose this effect for several reasons; but especially its ubiquitous use in the social sciences and the practicality of implementing an effect that we know well. In addition, MetaReviewer will calculate an effect size and variance for the following effect size types:
- SMD: Pretest only, Unadjusted Means
- SMD: Posttest only, Unadjusted Means
- SMD: Posttest only, Adjusted Means
- SMD: Pretest & Posttest, Unadjusted Means (Same Pretest and Posttest)
- SMD: Pretest & Posttest, Unadjusted Means (Different Pretest and Posttest)
- SMD: Pretest only, T Statistic
- SMD: Posttest only, T Statistic
- SMD: Pretest & Posttest, T Statistic
- SMD: Pretest only, F Statistic
- SMD: Posttest only, F Statistic
- SMD: Posttest, ANCOVA F Statistic
- SMD: Posttest only, Linear Regression Coefficient
- SMD: Posttest, Adjusted Linear Regression Coefficient
- SMD: Pretest only, Calculated SMD
- SMD: Posttest only, Calculated SMD
- SMD: Pretest & Posttest, Calculated SMD
We plan to update this list in the coming year with effects from clustered trials, dichotomous outcomes, and correlation coefficients (including partial correlations). We will update this post or create new posts as those effects go online. Until then – we hope these included effects are helpful!


