
At MetaReviewer, we're committed to supporting a diverse range of research projects—not just quantitative meta-analyses. We're excited to share how a team from Georgia State University used MetaReviewer for a non-quantitative systematic review and, in the process, helped us enhance our platform to better serve similar projects.
Exploring the landscape of teaching R in higher education
Quantitative research often relies on statistical programs like SPSS or SAS, which, while user-friendly, require costly subscriptions. Conversely, free and open-source alternatives like R offer accessibility and reproducibility but come with a steeper learning curve due to their programming requirements. Recognizing the benefits of open-source tools, Caroline Chubb, Hannah Scarbrough, and Terri Pigott set out to describe the research landscape for teaching researchers to use R. Understanding this landscape would help teachers to learn where using R as a teaching tool has been investigated, where we are lacking research, and possibly highlight methods or curricula that have been previously used.
Using MetaReviewer for a non-quantitative systematic review
That idea resulted in the team conducting a systematic review that identifies research on teaching in R. After screening thousands of articles, the team identified a handful that discussed the effects of teaching using R. They coded details of those studies in MetaReviewer. As part of their project, they encountered an important feature of MetaReviewer that had not previously been optimized for non-quantitative systematic reviews—which we addressed to expand the utility of MetaReviewer for their work. Put a pin in this point; we will describe it in greater detail below.
But first, a quick summary of their interesting findings. Importantly, the review team was interested in summarizing the contexts in which there is evidence of R being used for teaching. Just as important, they wanted to summarize where there isn’t documented evidence of teaching with R. Below is an evidence gap map from their research. This figure summarized the number of identified studies at the intersection of fields of study (on the x-axis) and types of study outcomes (on the y-axis). The size of the dot illustrates the number of studies at each intersection.
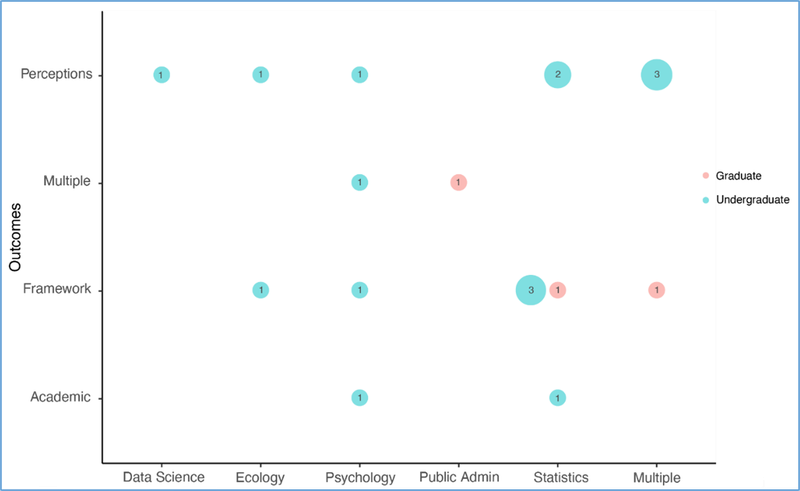
The coded outcomes indicate whether a study examined academic outcomes, student perceptions of the class, frameworks or structures for the course, or multiple outcomes. Blue dots represent classes with undergraduates; pink dots represent classes with graduate students.
Side note – Evidence Gap Maps are a super cool way of summarizing where there are...well...gaps in the literature. You can learn more about them at Polanin et al., 2022 (yes, the same Polanin who works on MetaReviewer ((yes, he is that into systematic reviews))).
What you can see in this figure is that there are several gaps. On the bright side, each of the fields the researchers examined has at least one study from the discipline. On the dark(?) side, the literature in those disciplines is fairly shallow. There are very few studies overall, and each area of study has, at most, a few studies examining teaching with R. So, there are both positives and negatives to take away from this project. We don’t know a ton about how to teach using R (or how effective that is compared to other programs). However, there’s at least a starting point for this work that already exists. As people who think there’s a lot of value to teaching using open access tools, we’re glad that this starting point exists (and that people are looking into this!).
Improving MetaReviewer through user collaboration
Time to return to that pin from earlier. During their project, the GSU team encountered challenges exporting data because MetaReviewer was initially optimized for quantitative syntheses involving effect sizes. Our hierarchical data system relied on an effect size page to organize data for export and required that effect size page to be present in order for users to download their data. Obviously, effect sizes were not applicable to the Georgia State team’s non-quantitative review. As a result of this dependency, when they went to export their data, they ran into some errors.
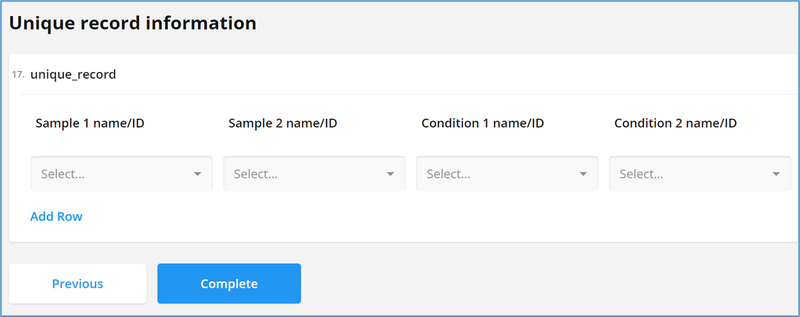
Hearing this feedback, we modified MetaReviewer in two ways. First, we created a new page for non-quantitative syntheses in our coding form templates. This new page, titled Unique record information, allows researchers to identify combinations of samples, conditions, and measures from their narrative synthesis for their data export. Second, we modified our data export function in MetaReviewer to use this page to knit together datasets for users conducting narrative syntheses. These developments were a direct result of feedback from this research team.
Open access tools are public goods – and made better because of the public
MetaReviewer, like R, is a freely available research tool. We can’t afford focus groups or armies of testers for our product. In many ways, we rely on our user base. This post highlights one example of users inspiring new developments – there are many others. We are indebted to the folks who are using our platform. Your creativity, your questions, and your patience help us to build a tool that is maximally useful to researchers. It might not feel like it, but you are often an active participant in the development of this public good. We are thankful to have you as a part of our team and our community.
And finally, if you’d like to know more about this research, check out: OSF | R Statistical Programming in Higher Education


